If you've ever tried to make a CMS or DXP platform decision using a Gartner Magic Quadrant or Forrester Wave, you already know the frustration. The reports are expensive to access. The inclusion criteria filter out platforms your team might actually want to use. And the nagging question about vendor influence never quite goes away. We built the DXP Scorecard because we believe technology leaders deserve better. It's live now at dxpscorecard.com, and it's free.
Why the Industry Needs a New Evaluation Model
For decades, enterprise technology decisions have been shaped by a small number of analyst firms. Gartner's Magic Quadrant and Forrester's Wave have become the default reference points for CTO shortlists and procurement committees. These reports served a real purpose in an era when platform capabilities were difficult to evaluate independently. Documentation was locked behind sales calls, and trial access was rare.
That era is over. Most modern CMS and DXP platforms now publish their documentation openly, offer free tiers or sandboxes, and maintain transparent pricing. The information asymmetry that gave analyst reports their power has largely dissolved. Yet the reports remain gated, expensive, and structured in ways that consistently favor large vendors with dedicated analyst relations programs.
The criticism isn't new. Industry practitioners have raised concerns about the relationship between vendor spending and analyst positioning for years. While firms like Gartner maintain that inclusion in a Magic Quadrant doesn't require payment, the dynamic is more nuanced than that. Vendors that invest in analyst relationships through paid advisory services, briefing cycles, and inquiry access tend to be better understood by analysts, and that understanding often translates into more favorable positioning. As one industry observer noted, the result is that platforms with larger marketing budgets and more aggressive analyst relations programs tend to score better in these reports, not necessarily because they are better platforms, but because they are better at marketing to analysts.
Forrester's Wave methodology carries similar structural challenges. The 2025 DXP Wave included only nine vendors, with explicit revenue thresholds that excluded entire categories of platforms. Headless CMS leaders like Sanity, Storyblok, and Payload CMS simply don't qualify, regardless of their technical capabilities or real-world adoption. Open source platforms face similar barriers to inclusion.
When the industry's most referenced evaluations systematically exclude entire platform categories, technology leaders are working with an incomplete picture. That's the gap we set out to close.
What the DXP Scorecard Actually Evaluates
The DXP Scorecard evaluates platforms across 104 scored criteria spanning eight weighted categories: Core Content Management, Platform Capabilities, Technical Architecture, Platform Velocity and Health, Total Cost of Ownership, Build Complexity, Maintenance Burden, and Use-Case Fit.
Every platform receives a structured scorecard. We don't reduce complex evaluations to a single dot on a quadrant. Each score includes a reasoning statement and a confidence level based on the quality of available evidence.
Our primary evidence sources include official technical documentation, API references, developer guides, release notes, architecture documentation, and hands-on implementation experience across production deployments. Where we rely on community resources, developer forums, or indirect evidence, we mark those scores with lower confidence levels. Every claim is traceable.
This is where our approach fundamentally differs from traditional analyst reports. We're not evaluating vendor pitches or curated demos. We're evaluating what engineering teams, digital marketers, and technology decision-makers actually encounter when they build on these platforms, informed by years of implementation experience across enterprise CMS ecosystems.
The Scorecard Includes Platforms the Analysts Don't
The current DXP Scorecard evaluates more than 16 platforms, including Sanity, SitecoreAI, Optimizely SaaS CMS, Adobe Experience Manager, Contentful, Contentstack, Storyblok, Bloomreach, Kontent.ai, Drupal, WordPress VIP, Magnolia, Strapi, Payload CMS, and Joomla.
Several of these platforms would never appear in a Gartner Magic Quadrant or Forrester Wave. Strapi and Payload CMS are open source platforms with growing enterprise adoption but no analyst relations budget. Joomla powers millions of websites globally but doesn't meet enterprise revenue thresholds. Even Sanity, one of the most technically advanced headless CMS platforms on the market, has historically been absent from or underrepresented in traditional analyst reports.
We evaluate platforms on technical merit and implementation reality, not on revenue thresholds, partner ecosystem size, or analyst relations investment. If an enterprise team is realistically considering a platform, it should be evaluated on equal footing with every other option.
An Open Methodology You Can Actually Inspect
Traditional analyst reports are proprietary. You pay thousands of dollars for access, and even then, the weighting methodologies, scoring criteria, and individual assessments remain largely opaque. If you disagree with a positioning, your recourse is limited.
The DXP Scorecard takes the opposite approach. Our methodology is open. The scoring framework, category weightings, and evaluation criteria are published alongside the results. If you believe a score is wrong, you can see exactly how we arrived at it and challenge the reasoning.
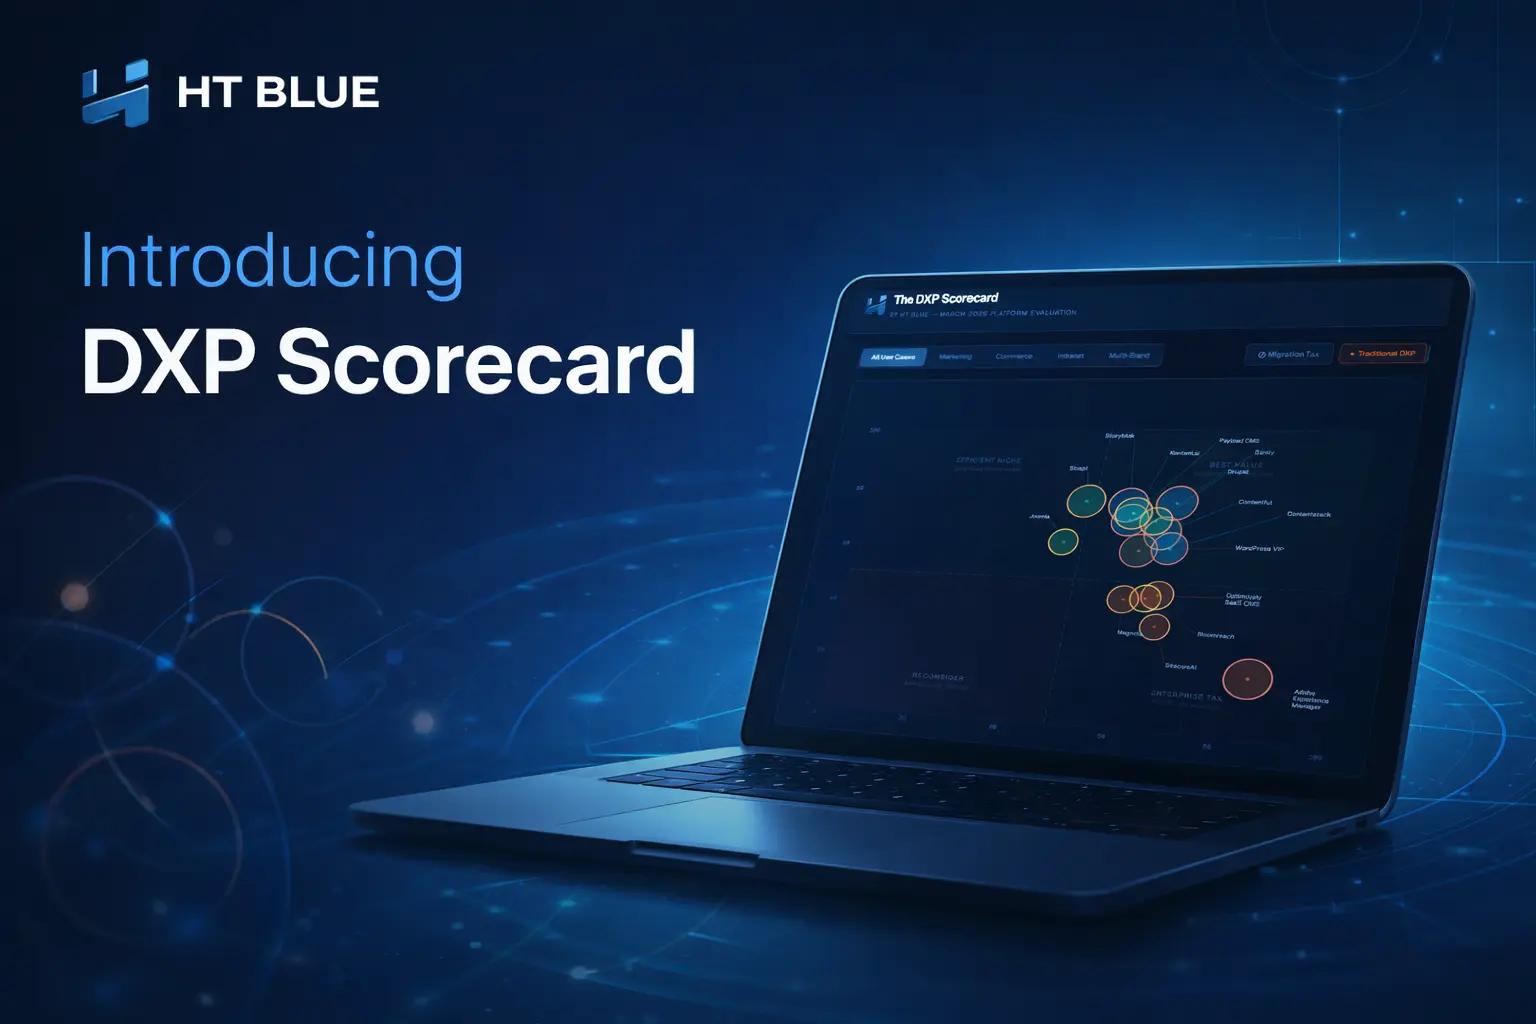
The interactive scorecard at dxpscorecard.com visualizes platforms across two primary axes: Capability Score and Cost-to-Feature Efficiency. Bubble size encodes build complexity, factoring in time-to-production, talent availability, and learning curve. Ring color indicates maintenance burden, covering upgrade overhead, security patching, vendor-forced migrations, and operational cost. A Migration Tax penalty adjusts cost efficiency based on vendor lock-in and exit difficulty.
This multi-dimensional view gives technology leaders a far richer picture than a two-axis quadrant can provide. A platform might score well on raw capability but carry significant maintenance overhead. Another might be highly cost-efficient but limited in scope. These tradeoffs matter enormously in real procurement decisions, and they deserve to be visible.
Why We're Qualified to Build This
HT Blue is a digital experience agency with deep implementation experience across every major CMS and DXP platform. We've migrated enterprises off Drupal, WordPress, Sitecore, and Adobe Experience Manager. We've built production systems on Sanity, Contentful, and Optimizely. We've debugged upgrade paths, calculated true total cost of ownership, and helped organizations recover from platform decisions that looked great in an analyst report but failed in production.
That implementation experience is what makes this scorecard different from a desk research exercise. When we score a platform's build complexity, it's informed by the hours our teams have actually spent building on it. When we assess maintenance burden, it reflects real operational costs we've observed across client engagements. When we flag migration tax, it's because we've helped organizations pay it.
We do have commercial relationships with some of the platforms we evaluate. We're transparent about that. But unlike traditional analyst firms, our scoring is not influenced by those relationships. Every platform is evaluated against the same criteria using the same methodology. Our reputation depends on getting this right, and we take that seriously.
How Technology Leaders Are Using It
The DXP Scorecard is designed for multiple audiences working through different stages of the platform selection process.
CTOs and technology architects use the capability and architecture scores to validate shortlists and identify platforms they may have overlooked. The technical depth of the evaluation, covering API design quality, SDK maturity, deployment flexibility, and security posture, provides the kind of detail that a Magic Quadrant simply cannot deliver in a two-axis visual.
Marketing directors and content strategists focus on the content management, workflow, and use-case fit scores. These evaluations address editor usability, localization support, preview quality, and structured content modeling from the perspective of the people who will actually use the platform daily.
Procurement teams use the TCO analysis and cost-to-feature efficiency scores to build business cases. Rather than relying on vendor-supplied pricing that often excludes implementation, hosting, and operational costs, the scorecard provides a normalized view of what platforms actually cost in production.
Digital agencies and system integrators reference the scorecard to guide client recommendations. Having an independent, transparent evaluation to point to removes the perception of bias that can complicate platform selection conversations.
What This Means for Enterprise Platform Decisions
The traditional analyst model isn't going away tomorrow. Gartner still generates over $5 billion in annual revenue, and procurement committees at large enterprises still reference Magic Quadrants as part of their evaluation process. But the model is showing strain. Gartner's stock has dropped significantly from recent highs, consulting revenue is declining, and the rise of AI-powered research tools is raising questions about the long-term value of proprietary analyst access.
More importantly, the DXP market itself has evolved beyond what traditional analyst frameworks were designed to evaluate. The shift toward composable architecture, headless CMS, and API-first platforms means that the most innovative solutions often don't fit neatly into legacy evaluation categories. Forrester acknowledged this tension in its 2025 Wave by noting that the very definition of a DXP is evolving as agentic AI transforms the category.
The DXP Scorecard was built for this new reality. It evaluates platforms as they exist today, accounts for the composable and headless paradigms that are reshaping the market, and treats technical merit as the primary evaluation criterion rather than market presence or vendor size.
Explore the Scorecard
The full DXP Scorecard is live at dxpscorecard.com. Every platform evaluation is free to access, with no registration wall and no gated content.
We update scores as platforms release major versions, change pricing, or shift their market position meaningfully. Each scorecard is timestamped with its evaluation date, and we recommend verifying scores against current documentation for any platform evaluation older than 12 months.
If you're in the middle of a platform decision, start by filtering the scorecard by your primary use case: marketing sites, commerce, intranets, or multi-brand environments. The visualization will adjust to show which platforms perform best for your specific scenario.
We built the DXP Scorecard because we believe platform selection decisions should be informed by implementation reality, not vendor marketing budgets. We hope it helps your team make a better decision.